“A 600-hectare regenerative program becomes far more defensible when 40 sensor-equipped hives, 20 control hives, two harvest cycles, and 180 farmer surveys are measured in one impact model.”
Many companies still describe regenerative agriculture through the easiest outputs to count: hectares converted, farmers trained, grants distributed. But the question a board, auditor, or investor ultimately asks is tougher: did the program improve ecological function in a way that measurably changed production risk, farmer resilience, and local wellbeing? Corporate social value is not a matter of intent. It is a matter of causal logic and evidence quality. That is why bees matter here not as a symbol of nature, but as a biological indicator set that can track pollination capacity, habitat quality, and ecosystem stress over time. If monitoring is designed well, bee health and pollinator activity can help place environmental benefit and social return inside the same auditable frame.
From Acres to Impact
In corporate-funded regenerative agriculture, the success metric is changing. Activity outputs still matter, but they are not evidence of impact by themselves. Area covered, support packages distributed, or training sessions delivered show what a company did, not what it changed. Impact starts with harder questions: did pollination capacity improve? Did habitat fragmentation decline? Did yield variability fall in target crops? Did the risk of farmer dropout decrease? Did the program gain legitimacy in the community?
In Turkey, those questions are not only environmental. They are also economic and social. Policy and economic assessments produced across the TOBB ecosystem in 2023 and 2024, including work on agriculture, labor, and regional development, consistently place farming alongside demographic and social indicators rather than treating it as a standalone ecological issue. That matters because regenerative agriculture is not just a land management intervention. It is tied to rural income stability, sourcing continuity, and local economic resilience. For corporate reporting, this means environmental ROI and social ROI should not be separated into two unrelated narratives if they are generated by the same field intervention.
For a food, retail, or FMCG company, the implication is practical. A program in contracted sourcing regions should not be reported only through farmer reach. It can instead present pollinator-friendly habitat share, observed bee activity during flowering, crop-level yield stability, farmer training retention, and local supply continuity in one package. That shifts the report from a coverage story to a risk-and-value story.
The key is to make the causal chain explicit rather than implied. A defensible mini-framework looks like this: - Pollination capacity improves: verified through hive sensor data, transect counts, flowering density, and pollinator visitation rates. - Yield stability improves: verified through plot-level harvest records, two-season comparisons, and reference or control areas. - Income volatility declines: tested through farmer sales records, contract continuity, repayment discipline, and survey data. - Community resilience strengthens: assessed through program retention, trust indicators, participation by women and young producers, and seasonal livelihood signals.
This chain will not operate with equal strength across every crop or geography. But once each link is tied to a specific data source, corporate social value stops being a narrative flourish and becomes a testable hypothesis. Core KPI set proposed in this section: colony activity index, pollinator-friendly habitat share, crop-level yield volatility, farmer retention in program.
Language of Bee Data
ESG literature increasingly connects environmental and social performance with corporate performance, but conceptual acceptance is not the same as field-grade proof. Sustainability and social impact discussions published in the Third Sector Social Economy Journal in 2022 and 2023 point to the same problem: without verifiable field data, corporate claims remain generic. Bee colony health, pollinator activity, and habitat indicators are one of the few data layers that can narrow that gap, because they lend themselves to time series, comparison, and cross-validation.
Bees, especially managed Apis mellifera colonies, can function as biological sensors of ecosystem change. Flight intensity, internal hive temperature and humidity, hive weight change, acoustic patterns, and foraging behavior provide indirect but useful signals about environmental stress, floral resource access, and flowering synchrony. For wild pollinators, transect surveys, camera-based species detection, floral cover analysis, and habitat continuity metrics can serve a similar role. For companies, the practical shift is clear: “we support biodiversity” can become a reportable indicator set rather than a static annual statement.
This is where IoT, computer vision, and remote sensing become operationally relevant. Hive-based sensors provide continuous data; satellite imagery and field observations add context on land-use change, flowering patterns, and habitat integrity. But bee data should not be mistaken for a self-explanatory answer. Pesticide exposure, extreme weather, water stress, pathogen load, surrounding monoculture pressure, and beekeeping practice can all alter the readings. An increase in colony activity does not automatically prove project success; seasonality or external climate conditions may generate the same signal.
Those limitations do not weaken the approach; they define the standard for using it responsibly. A stronger design includes at least a 12-month baseline, a control or reference area with similar agroecological conditions where feasible, and cross-checks against independent botanical surveys and farm records. Under those conditions, bee data becomes more than a compelling metaphor. It becomes a decision-support layer for environmental benefit, social license, and reporting credibility. Core KPI set proposed in this section: flight activity, hive weight change, wild pollinator observation frequency, habitat continuity score.
Hybrid Impact Ledger
A credible corporate social value narrative cannot be built on sensor data alone. Social impact measurement requires sampling logic, valid and reliable survey instruments, clear hypotheses, and consistent statistical methods. That is a standard lesson from social science methodology. If the link between biophysical change and social outcome is not measured directly, value attribution remains speculative. The strongest approach is therefore a mixed-method model that places biological data and community data in the same impact ledger.
On one side of that ledger sit biophysical indicators: bee health, pollination activity, flowering synchrony, habitat patch continuity, land-use change, and crop-specific yield stability. On the other side sit social indicators: farmer income perception, observed income fluctuation, perceived production risk, learning outcomes from training, continuity of participation, inclusion of women and young producers, local benefit perception, and community trust. Read together, these columns answer the question a CFO is likely to ask: through what mechanism did the budget create measurable value?
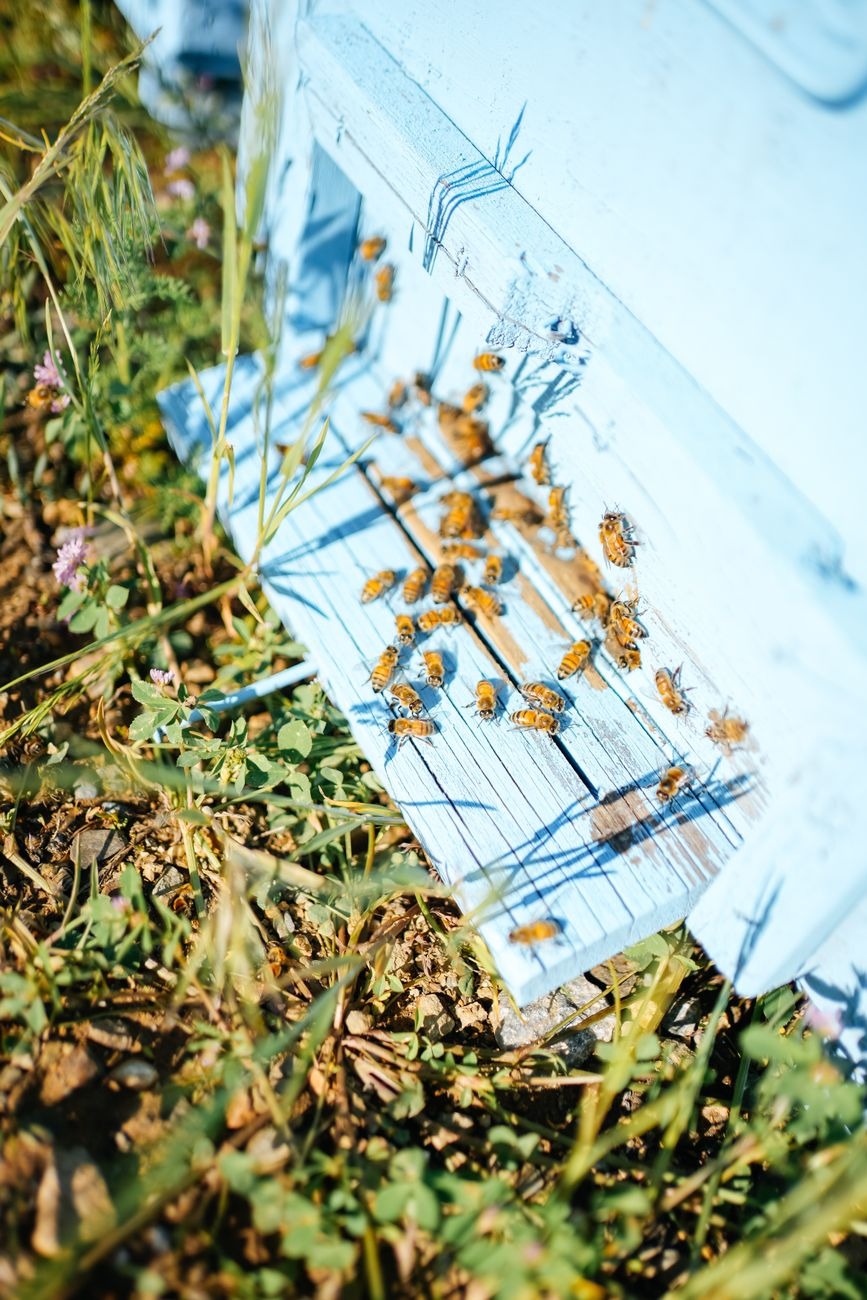
Consider a concrete use case. A food retail company runs a regenerative agriculture program across 600 hectares in a contracted fruit and vegetable sourcing zone. The design begins with a 12-month baseline. Data from 40 sensor-equipped hives in the project area is compared with 20 hives in a control area with similar climate and crop structure. Flowering intensity is tracked across two harvest cycles using satellite imagery and field botany counts. At the same time, 180 farmers complete baseline and endline surveys, with a 60-farmer panel followed throughout the period. The company is then able to report not only changes in bee activity, but also lower yield volatility in selected crops, shifts in contract renewal rates, and stronger program retention. That kind of design allows environmental return and social return to sit under one methodological roof.
A second scenario involves a bank or holding company financing pollinator-friendly agriculture through a rural development budget. The impact framework is defined upfront: a 24-month monitoring window, three districts, four site clusters including one reference cluster, 250 household surveys, and seasonal indicators for employment and production continuity. Sensor time series are matched with field observations, focus groups, and local economic data. The final board report does not stop at “we funded this initiative.” It shows which indicators moved, by how much, which findings are supported by stronger evidence, and which still require longer observation.
Caution remains essential. Short monitoring windows, weak control areas, data loss, self-report bias, and crop-specific differences can all weaken interpretation. Pollination benefits may be strong in some systems and modest in others. But a well-designed hybrid model is still far more auditable, decision-useful, and defensible than a simple activity report. Core KPI set proposed in this section: change in yield volatility versus baseline, income fluctuation score, contract renewal rate, community trust index.
Corporate social value is no longer mainly a communications exercise. It is a measurement architecture. In that architecture, bees are not a decorative biodiversity symbol; they are an evidence layer capable of translating ecological function into corporate decision language. When robust research design, mixed-method impact measurement, and the right monitoring tools are used together, regenerative agriculture projects move from goodwill claims to defensible investment logic. One practical note is enough: platforms such as Motesari and PolliNex can help operationalize that evidence flow, but the real advantage lies in design discipline. Social value that cannot be measured cannot be defended, and bee data helps build that defense.